GUI Testing Guide
Use this guide to verify the Py3plex GUI before merging or releasing. It covers automated CI runs and manual smoke tests.
Visual Interface Preview
The Py3plex GUI consists of several key pages that work together for network analysis:
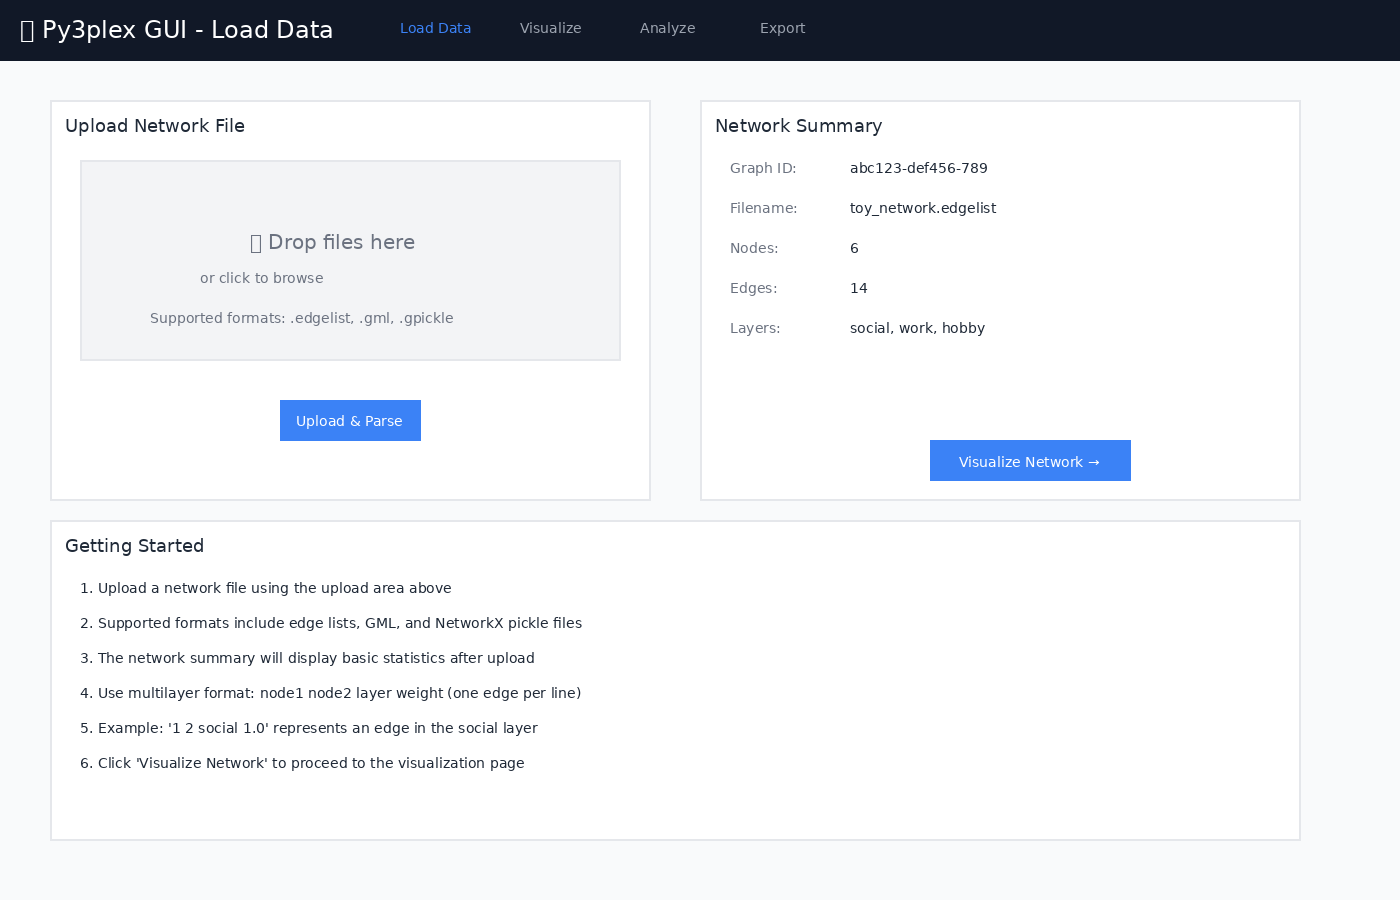
Load Data Page - Upload and parse network files
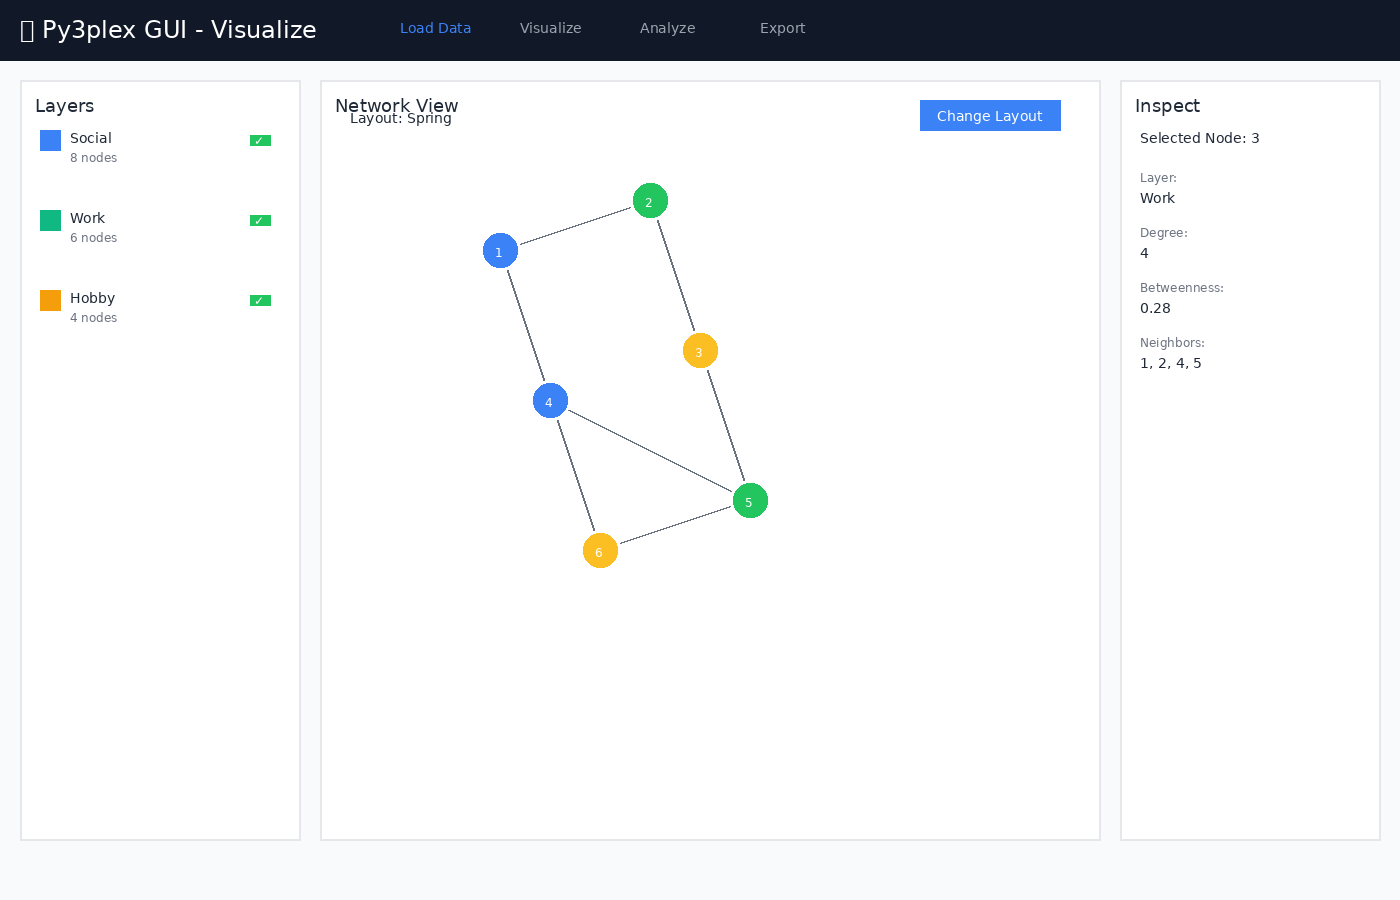
Visualize Page - Interactive network view with layer controls
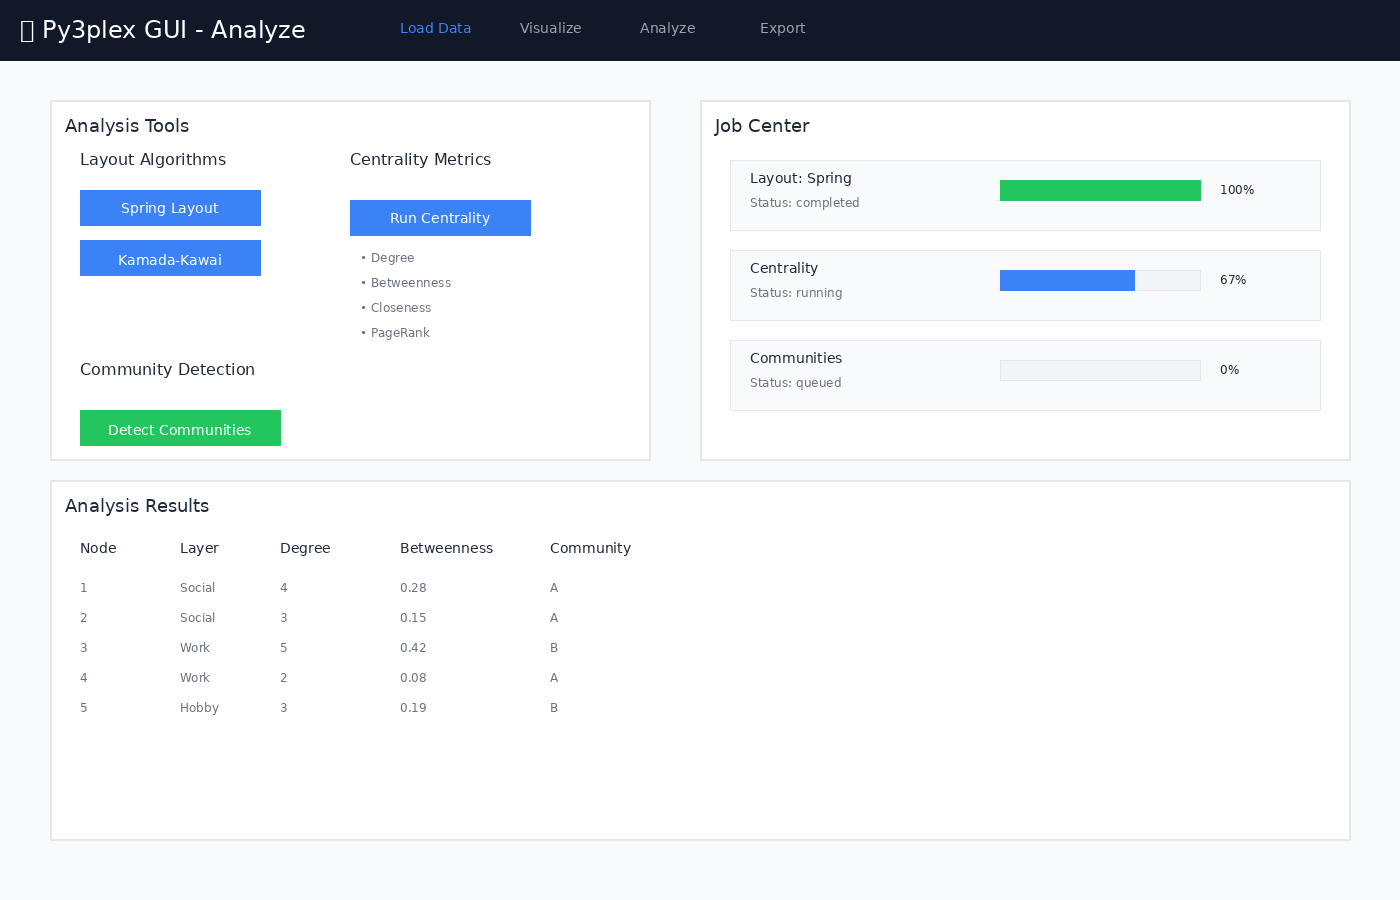
Analyze Page - Run jobs and monitor progress
Automated Testing (CI)
GitHub Actions Workflow
All GUI tests run automatically on GitHub Actions to prevent regressions in the API, worker, and frontend:
Workflow: .github/workflows/gui-tests.yml
Triggers:
Push to main/master/develop branches (if
gui/files changed)Pull requests targeting main/master/develop (if
gui/files changed)Manual workflow dispatch
Test Jobs:
API Tests (~5 min)
Build API, worker, redis containers
Run pytest suite:
ci/api-tests/Validate health endpoint
Test file upload functionality
Integration Tests (~10 min)
Build all services (including nginx, frontend)
Test full upload → analyze → export flow
Validate layout job execution
Test centrality computation
Verify service health
Frontend Build (~5 min)
Type check TypeScript
Build production bundle
Verify dist output
View Results: Check the Actions tab on GitHub or the CI badges in the repository README
Running CI Tests Locally
You can run the same tests locally (requires Docker Compose v2 and npm). Stop any existing GUI stack first so ports are free:
cd gui

# API tests
# Uses sample data and pytest checks in ci/api-tests/
docker compose build api worker redis
docker compose up -d api worker redis
docker compose exec api pytest ci/api-tests/ -v
docker compose down -v

# Integration tests
docker compose up -d --build
# Wait for services to become healthy
curl -f http://localhost:8080/api/health
# Run manual integration tests (see below) or add automated steps here
docker compose down -v

# Frontend build
cd frontend
npm ci
npm run build
Manual Testing Guide
Follow these manual smoke tests after standing up the stack locally. Keep logs open in another terminal so you can capture failures quickly, and only proceed once all services report healthy.
Prerequisites
Docker and Docker Compose installed
At least 4GB RAM available
Ports 8080, 5555, 8000, 6379 available
Sample file available at
gui/toy_network.edgelist(included in repo)
Setup
cd gui
cp .env.example .env
make up
Expected: All containers start successfully. Check with docker compose ps and wait until services report healthy before proceeding.
Test 1: Health Check
API Health
curl http://localhost:8080/api/health
Expected Response:
{"status":"ok","version":"0.1.0"}
Frontend Access
Open browser to http://localhost:8080
Expected: React app loads with navigation bar showing:
Load Data
Visualize
Analyze
Export
Flower Dashboard
Open browser to http://localhost:5555
Expected: Celery Flower dashboard loads showing workers.
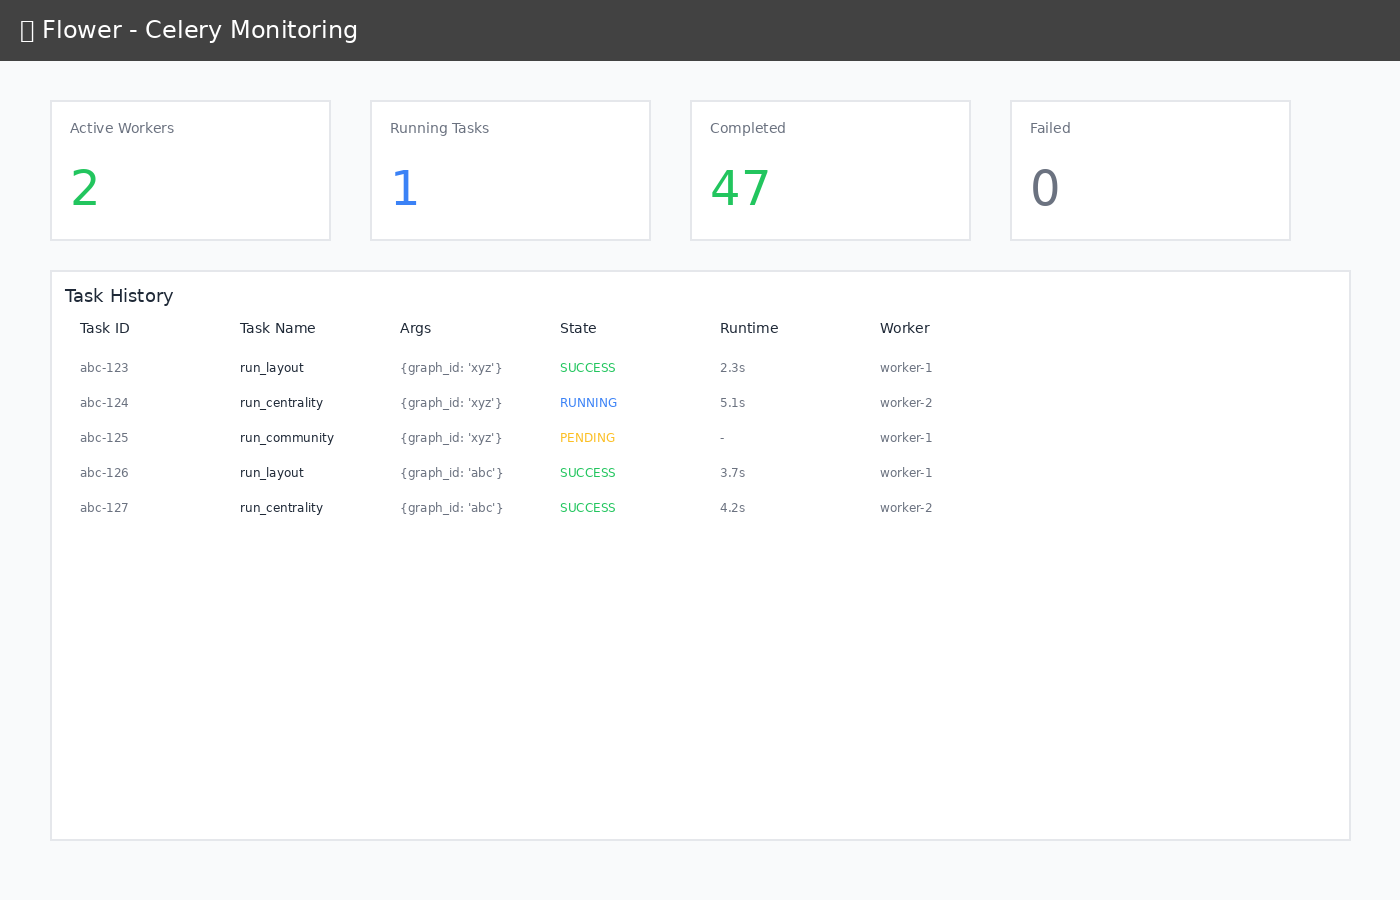
Flower monitoring dashboard showing task history and worker status
Test 2: Upload Network
Navigate to Load Data page
Click “Click to upload” or drag and drop
toy_network.edgelist(repo copy lives ingui/toy_network.edgelist)Click “Upload & Parse”
Expected:
Upload progress indicator appears
Network Summary displays:
Graph ID (UUID)
Filename:
toy_network.edgelistNodes: 6
Edges: 14
Layers: hobby, social, work
No error alerts or toast messages
Test 3: Visualize Network
Click “Visualize Network →” or navigate to Visualize page
Expected:
Page shows three panels: Layers, Network View, Inspect
Network View shows placeholder with “Graph with X nodes”
No errors in browser console
Test 4: Run Layout Job
Navigate to Analyze page
Click “Run Spring Layout” button
Expected:
Job appears in Job Center below
Status shows “queued” → “running” → “completed”
Progress updates (10% → 30% → 80% → 100%)
Job shows green checkmark when complete
Verify in Flower
Open
http://localhost:5555Check “Tasks” tab
Expected: Layout task appears with status SUCCESS
Test 5: Run Centrality Analysis
On Analyze page, click “Run Centrality” button
Expected:
New job appears in Job Center
Type: “Centrality”
Status progresses to “completed”
No errors
Test 6: Run Community Detection
On Analyze page, click “Detect Communities” button
Expected:
New job appears in Job Center
Type: “Community Detection”
Status progresses to “completed”
Result includes number of communities found
Test 7: Export Workspace
Navigate to Export page
Enter workspace name: “test-workspace”
Click “Save Workspace Bundle”
Expected:
Success message: “Workspace saved as test-workspace_{uuid}.zip”
Workspace ID displayed
Verify File Created
ls -lh gui/data/workspaces/
Expected: Zip file exists with recent timestamp
Test 8: API Direct Testing
Upload via API
curl -F "file=@toy_network.edgelist" \
  http://localhost:8080/api/upload
Expected: JSON response with graph_id (save it for the next steps).
Get Graph Summary
GRAPH_ID=<from_previous_step>
curl http://localhost:8080/api/graphs/$GRAPH_ID/summary
Expected: JSON with node, edge, and layer counts matching the upload.
Start Layout Job
curl -X POST \
  -H "Content-Type: application/json" \
  -d '{"algorithm":"spring","seed":42,"dimensions":2}' \
  http://localhost:8080/api/graphs/$GRAPH_ID/layout
Expected: JSON response with job_id
Check Job Status
JOB_ID=<from_previous_step>
curl http://localhost:8080/api/jobs/$JOB_ID
Expected: JSON with status, progress, and a result payload when complete.
Test 9: Logs Inspection
# View all logs
make logs

# Or individual services
docker compose logs api
docker compose logs worker
docker compose logs frontend
Expected: No error messages, only INFO level logs
Test 10: Container Health
docker compose ps
Expected: All services show “healthy” or “running”
Test 11: Data Persistence
Upload a network
Run a layout job
Stop containers:
make downRestart:
make upUpload same network again
Expected:
Uploads work after restart
Previous artifacts still in
gui/data/(verify workspace ZIPs and layout outputs exist)
Test 12: Multiple Jobs
Navigate to Analyze page
Quickly click:
Run Spring Layout
Run Centrality
Detect Communities
Expected:
All three jobs appear in Job Center
Jobs process in parallel (check Flower)
All complete successfully
Common Issues
Port Already in Use
# Find and kill process
lsof -ti:8080 | xargs -r kill

# Or change port in docker-compose.yml
ports:
  - "8081:80"
Container Won’t Start
# Check logs
docker compose logs <service>

# Rebuild
make down && make build && make up
Permission Errors
# Fix data directory permissions
sudo chown -R $(whoami):$(whoami) gui/data/
Frontend Can’t Reach API
Check nginx config:
docker compose exec nginx cat /etc/nginx/nginx.conf
Test API directly:
curl http://localhost:8000/api/health
Cleanup
# Stop and remove everything
make down

# Full cleanup including data
make clean
Test Checklist
[ ] Health endpoints respond
[ ] Frontend loads
[ ] Flower dashboard accessible
[ ] File upload works
[ ] Graph summary displays
[ ] Layout job completes
[ ] Centrality job completes
[ ] Community detection works
[ ] Workspace save succeeds
[ ] Job progress updates in real-time
[ ] Multiple concurrent jobs work
[ ] Logs show no errors
[ ] Data persists across restarts
Performance Benchmarks
For reference, on a typical development machine (approximate and hardware-dependent):
Startup time: 30-60 seconds (first build: 3-5 minutes)
Upload (toy network): < 1 second
Layout job: 2-5 seconds
Centrality job: 1-3 seconds
Community detection: 1-3 seconds
Larger networks (1000+ nodes) may take proportionally longer.
Security Testing (Development Mode)
WARNING: Do NOT expose to public internet without:
[ ] Changing CORS settings
[ ] Adding authentication
[ ] Enabling HTTPS
[ ] Setting rate limits
[ ] Validating file uploads strictly
These checks are meant for local verification only; harden the deployment before opening any external access.
Next Steps
If all tests pass:
Try with real network datasets
Test with large graphs (1000+ nodes)
Load test with concurrent users
Profile memory usage
Test edge cases (malformed files, very large files)
Capture logs and screenshots for any failing scenario before filing issues
—
Last Updated: 2025-11-09
Version: 0.1.0